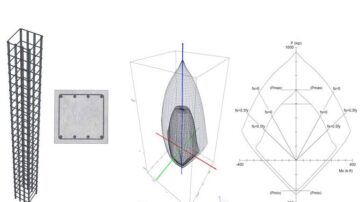
What is a Column Interaction Curve?
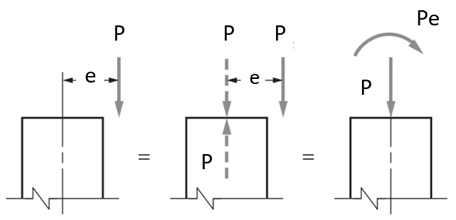
Vertical members that are part of a building frame are subjected to combined axial loads and bending moments. These forces develop due to external loads, such as dead, live, and wind loads. Simply put, an interaction diagram (or curve) displays the combinations of acceptable moment and axial capacities of a structural member. The equivalency between an eccentrically applied load and an axial load–moment combination is shown below. Assume that a force P is applied to a cross section at a distance e (eccentricity) from the centroid. Eccentric force P may now be combined with the force P acting downward at the centroid and a couple Pe, that is a pure moment.
Different position of axial force from the section centroid produces various behaviors of a column as well as stress distribution in sections. These are plotted on the M-N Interaction Curve:
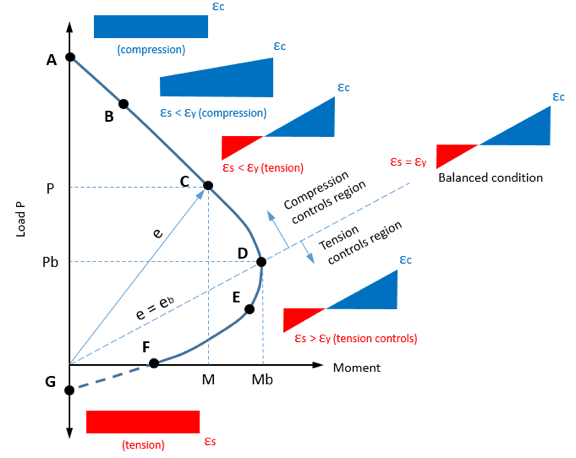
Pure axial compression (point A). This is the largest axial compression load that column can support.
Compression with minor bending (point B). This is the case of a large axial load acting at a small eccentricity. The stress distribution becomes inclined but section is still under compression. Failure occurs by crushing of the concrete.
Compression control (point C). Here exist both compression zone and tension zone of concrete. Steel is subjected to tension. Failure occurs by crushing of the concrete on the compression side, whereas the stress in steel fs is less than the yield stress fy.
Balanced condition (point D). A balanced condition is reached when the compression strain in the concrete reaches limited and the tensile reinforcement reaches yielding simultaneously. Failure of concrete occurs at the same time as the steel yields.
Tension control (point E). This is the case of a small axial load with large eccentricity, that is, a large moment. At failure, the strain in the tension steel is greater than the yield strain.
Pure flexure (point F). The section in this case is subjected to a bending moment M, whereas the axial load is P = 0. Failure occurs as in a beam subjected to bending moment only.
Pure axial tension (point G). This is the largest axial tension load that column can support.
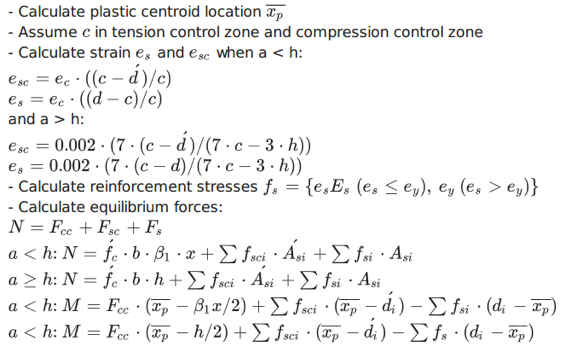
Typically, there are three main points: maximum axial tension (point G), maximum axial compression (point A) and balanced condition (point D). Then intermediate points are considered from balanced condition to maximum tension (points D-G) and from balanced condition to maximum compression (points D-A). To calculate all that points as per design codes used next assumptions:
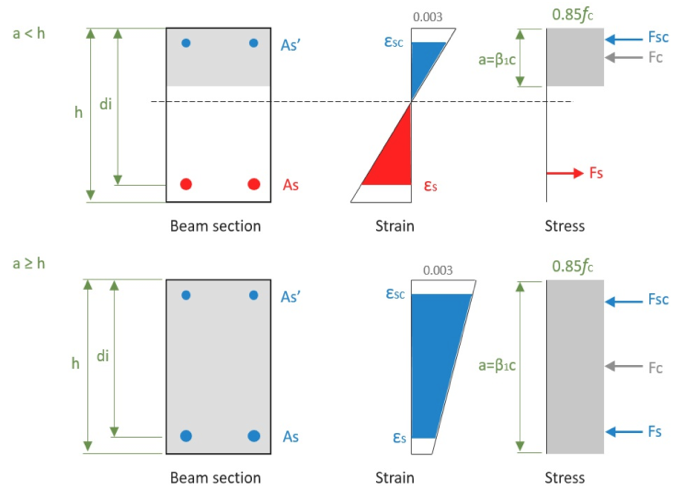
>Strains in concrete and steel are proportional to the distance from the neutral axis
>Equilibrium of forces and strain compatibility must be satisfied
>The maximum usable compressive strain in concrete is 0.003
>Strength of concrete in tension can be neglected
>The concrete stress block may be taken as a rectangular shape
The strength of a column cross-section can be determined from the geometry of the cross-section, the constitutive relationships of the concrete and steel and a consideration of equilibrium and strain compatibility. For calculation of intermediate M-N curve points that are describe the strength of section in iterative process. The next steps are involved in this process as per ACI code:
Interpreting the Interaction Curve
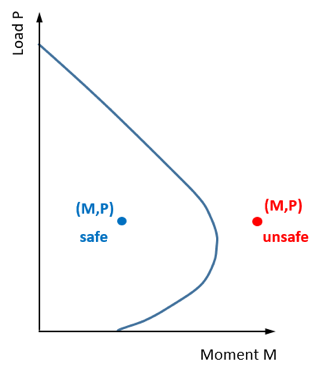
For the design of a column to be considered adequate (safe), the combination of action effects (M, P) must be less than the combination of design strengths (M, P) from the interaction curve. This means that if the position of the M,P point on the plot is outside of the curve it is deemed as not meeting this criteria and considered unsafe.
Leave a Reply
You must be logged in to post a comment.